- This topic is empty.
-
Topic
-
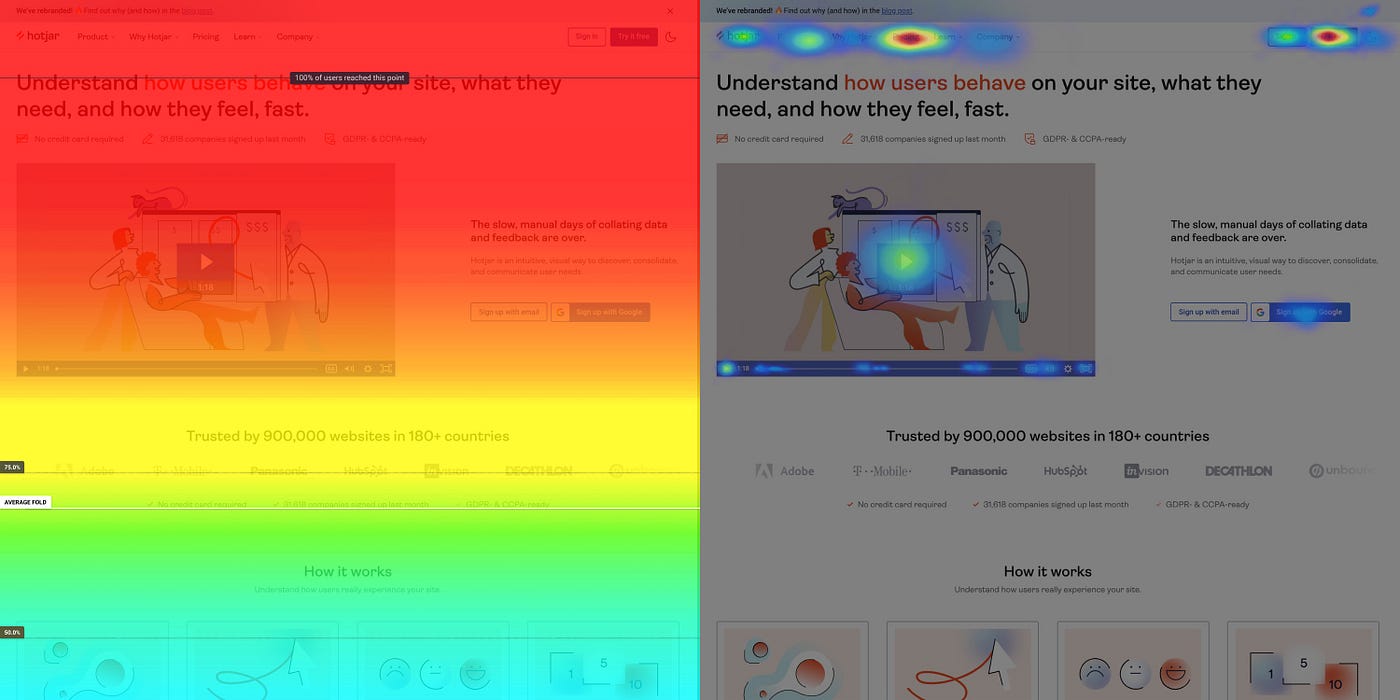
A heatmap in the context of UX (User Experience) and analytics refers to a graphical representation of data that is used to visualize and understand user behavior on a website, application, or digital product. Heatmaps provide valuable insights into how users interact with a digital interface by visually highlighting areas of interest or interaction intensity. There are several types of heatmaps commonly used in UX and analytics:
- Click Heatmaps: These display where users click most frequently on a webpage or within an application. They use color coding to indicate areas with the highest and lowest click activity, helping designers and analysts identify which elements or links attract the most attention.
- Move Heatmaps: Track the movement of the user’s cursor as they navigate a webpage. These heatmaps show the flow and path users take when exploring a site, which can be useful for optimizing the layout and placement of elements.
- Scroll Heatmaps: Show how far down a page users typically scroll. They help designers understand where users are dropping off or losing interest, which can inform content placement and design decisions.
- Attention Heatmaps: Combine various user interactions like clicks, cursor movement, and dwell time to create a comprehensive view of where users focus their attention on a page. This can be especially helpful in understanding what content or elements are most engaging.
- Segmented Heatmaps: Some heatmap tools allow you to segment user data by different attributes such as traffic source, device type, or user demographics. This enables you to analyze how different user groups interact with your digital product.
Heatmaps are often used in conjunction with other UX research and analytics tools to gain a better understanding of user behavior. They can help UX designers and product managers make data-driven decisions to improve the user experience, optimize conversion rates, and enhance the overall usability of a website or application. They are typically generated using specialized analytics tools or software that track and record user interactions on a digital platform.
In the context of UX and analytics they are a visual representation of user behavior data, and it helps designers and analysts identify patterns and areas of interest or concern within a digital interface to improve user experience and achieve business goals.

Predictive Heatmapping
Predictive heatmapping involves using data analysis and machine learning techniques to anticipate user behavior and identify potential areas of interest or concern on a website or application.
- Data Collection: Collect relevant data about user interactions with your website or application. This can include data such as click-through rates, scroll depth, time spent on pages, conversion rates, and any other relevant metrics. Ensure that you have enough historical data to perform meaningful analysis.
- Data Preprocessing: Clean and preprocess the collected data. This may involve handling missing values, removing outliers, and normalizing or scaling data as needed. Ensure that the data is in a format suitable for machine learning.
- Feature Engineering: Create meaningful features from the raw data that can be used as input for predictive modeling. For example, you can engineer features related to user demographics, device type, geographic location, and more.
- Selecting a Predictive Model: Choose a suitable machine learning model for predictive heatmapping. Common choices include regression models, decision trees, random forests, or more advanced techniques like neural networks. The choice of model will depend on the nature of your data and the complexity of the problem.
- Training the Model: Split your data into training and testing sets. Train your predictive model on the training data, using the historical data to learn patterns and relationships between user behavior and various features.
- Validation: Evaluate the performance of your predictive model using the testing dataset. Common evaluation metrics include Mean Absolute Error (MAE), Root Mean Squared Error (RMSE), or others relevant to your specific problem.
- Predictive Heatmap Generation: Once your model is trained and validated, use it to make predictions for user behavior on your website or application. These predictions can include metrics like the probability of a user clicking on a particular element, spending a certain amount of time on a page, or converting on a specific call to action.
- Heatmap Visualization: Create visual heatmaps based on the predictions generated by your model. These heatmaps should highlight areas of interest or concern on your website or application. Heatmap colors can represent the predicted probability or intensity of user interactions.
- Interpretation: Analyze the predictive heatmaps to gain insights into potential UX improvements. Identify areas where user engagement is predicted to be high and low. Focus on making changes to optimize the user experience in these areas.
- Iterate and Test: Implement UX changes based on your heatmap analysis and monitor user interactions after these changes. Continuously collect new data and refine your predictive models to improve accuracy and effectiveness.
Advantages
- Visual Clarity: Provide a visually intuitive representation of data, making complex information easier to understand at a glance. Patterns and trends are quickly identifiable through color differentiation.
- Efficient Data Exploration: Allow users to explore large datasets efficiently. They condense information into a compact, easily digestible format, reducing the need to scroll through lengthy tables or lists.
- Pattern Identification: Excel at highlighting patterns and correlations in data. Users can quickly identify clusters, outliers, and trends by observing the concentration of color in specific areas.
- Spatial Insights: In geographic heatmaps, spatial relationships and geographical trends become evident, aiding in location-based decision-making and analysis.
- User Behavior Analysis: Website heatmaps help businesses analyze user interactions by showing where users click, hover, or scroll most frequently. This data can inform website design and optimization efforts.
- Data Comparison: Facilitate the comparison of multiple datasets or time periods. By overlaying heatmaps, users can discern changes and differences in data distributions.
- Decision Support: Provide valuable insights for decision-making. In various fields, such as finance, marketing, and healthcare, they aid in identifying opportunities and areas requiring attention.
- Communication: Effective tools for communicating data-driven insights to stakeholders who may not have specialized data analysis skills. They convey information in a visually appealing manner.
- Customization: Many heatmap tools allow users to customize color scales, thresholds, and other parameters to tailor the visualization to their specific needs and preferences.
- Real-time Analysis: Some heatmap applications offer real-time tracking and analysis, enabling organizations to respond quickly to changing conditions or user behavior.
- Usability Testing: Website heatmaps assist in usability testing by revealing how users interact with web pages. This information helps designers and developers optimize user interfaces.
- Data-Driven Marketing: Can inform marketing strategies by visualizing customer behaviors and preferences. Marketers can tailor campaigns based on these insights.
- Scientific Research: In scientific research, heatmaps are used to visualize experimental data, gene expression levels, and other research findings. They aid in hypothesis testing and data interpretation.
- Risk Assessment: Geographic heatmaps can assist in risk assessment by displaying data related to natural disasters, disease outbreaks, or other hazards, helping authorities make informed decisions.
- Resource Allocation: In fields like logistics and urban planning, heatmaps can help allocate resources more efficiently by identifying areas with high demand or specific needs.
- Aid in Problem-Solving: By highlighting areas of concern or opportunity, heatmaps assist in problem-solving and decision-making processes.
Disadvantages
- Sensitivity to Data Size: Can become less informative when dealing with very large datasets. Overlapping data points can obscure patterns, and the heatmap may lose its clarity.
- Color Scale Interpretation: The interpretation of heatmaps depends heavily on the chosen color scale. If the color scale is not chosen carefully or is not intuitive, it can lead to misinterpretations or biased conclusions.
- Loss of Detail: Are designed to provide an overview, and in doing so, they may lose some detail present in the raw data. This can be problematic in cases where fine-grained information is important.
- Assumes Spatial Homogeneity: Spatial heatmaps assume that the distribution of data is uniform within each area represented by a color cell. In reality, spatial variation may exist within those areas, and this nuance can be lost.
- Data Distribution Shape: Do not provide information about the shape of data distribution. For example, a high concentration of data points could indicate a cluster or a continuous gradient, and a heatmap alone might not distinguish between these.
- Misleading Visuals: Improper use of color scales or overemphasis on certain areas in a heatmap can lead to biased or misleading interpretations. This is especially true when users do not understand the visualization.
- Noisy Data: Can accentuate noise in data, leading to the perception of patterns or correlations that do not actually exist. Proper data preprocessing is crucial to avoid this issue.
- Interpolation: When generating a heatmap, data points are often interpolated to create a smooth transition between colors. This can introduce inaccuracies, especially when dealing with sparse data.
- Limited to Two Dimensions: Traditional ones are typically two-dimensional representations and may not be well-suited for visualizing higher-dimensional data without additional techniques (e.g., parallel coordinate plots).
- Limited to Quantitative Data: Are most effective for visualizing quantitative data. They may not be suitable for categorical or qualitative data, which may require different visualization methods.
- Scalability: May not scale well to extremely large datasets due to computational and visual limitations.
- Subjectivity: Interpretation of heatmaps can be subjective, and different users may draw different conclusions from the same visualization.
- Data Selection Bias: The effectiveness of heatmaps depends on the selection of data and the choice of features. Biased or incomplete data can lead to biased heatmap results.
- Privacy Concerns: In some cases, geographic heatmaps may inadvertently reveal sensitive or private information about individuals or locations. Care must be taken to protect privacy when working with such data.
- Complexity: Creating and interpreting heatmaps can be complex, especially for individuals who are not familiar with data visualization concepts. Misuse or misinterpretation is possible.
- You must be logged in to reply to this topic.